

A subscriber booked a portfolio review call with me a few weeks ago and opened with the question I hear more than any other. He had $300,000 built up over two decades of saving, and he wanted a real number he could plan a life around. He was an expat living in Mexico, so he could get by on $2,500 a month. 60 Seconds to FIRE covers a lot of high quality locations to stretch your dollars.
‘How Much Income Can I SAFELY Generate In Dividends?”
His number was $300,000. This article works the same math on $500,000, but the framework does not care about the size of the account. It cares about the percentage, the fund selection behind it, and the tax treatment on top. Scale it up or down and the logic holds. My answer was to basically compile those funds into three different positions, which I will share with you here.

That is exactly the kind of question a single article can only answer in general terms. Your number, your tax bracket, your timeline, and your other holdings change the specific allocation. If you want the version built around your actual account instead of a hypothetical $500,000, that is what the calls are for.
I am at max capacity for the next few weeks, but I can complete written portfolio reports for your holdings.
The 4% Rule Was Never Built for This
Most retirement math starts with the 4% rule, and most retirement math disappoints people who actually run the numbers. Apply it to $500,000 and you get $20,000 a year. That covers property tax and groceries in most parts of the country. It does not cover a retirement.
The 4% rule was built to answer one question: how much can you withdraw without running out of money in thirty years. It was never built to answer the question retirees actually ask, which is how much income can this portfolio produce right now. Although there are a lot of great resources out there to make you a better investor, some people don’t want to actively manage positions.
20 Financial Terms That Make You A Better Investor → Macro investing - Gertjan
The income-focused answer looks completely different. Instead of slowly selling shares and hoping the math holds for three decades, you build a portfolio engineered to pay you in cash, every month, without touching the principal. The target shifts from a withdrawal percentage to a yield percentage, and $500,000 yielding a blended 10% pays close to $50,000 a year without selling a single share.
For instance, I collected $3,628 in dividends in June. Only a third of that income is actually taxable.

Three Funds, Three Different Tax Advantages
Every fund in this engine earns its spot for two reasons, not one. The yield gets you interested, but the tax treatment is why it stays in the portfolio. Ordinary income from a job gets taxed at your full marginal rate plus payroll tax. Almost nothing in this engine gets taxed that way, and that difference is worth thousands of dollars a year on its own.
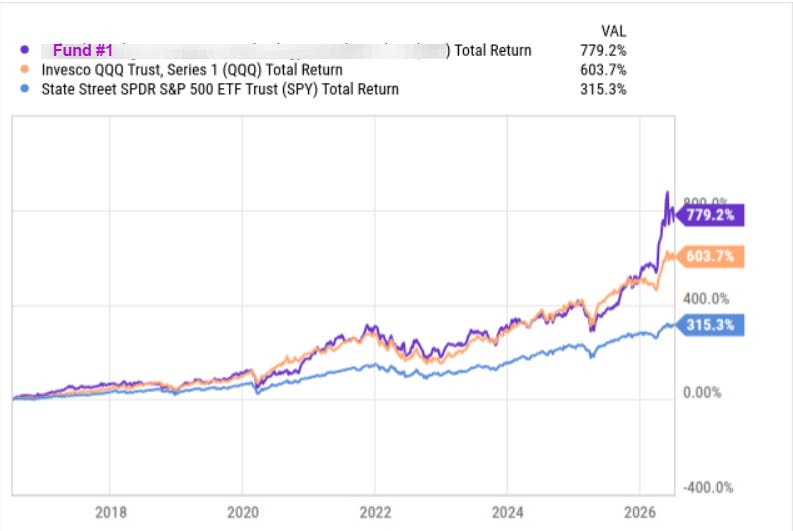
Fund #1 has outperformed the S&P 500 and the Nasdaq-100, all while offering an average yield of 7%.
Fund #2 offers 100% return of capital distributions, meaning tax-deferred.
Fund #3 takes a value approach and allows investors to get a double-digit yield.
Want a list of funds rated by quality? Paid subscribers get access to the high yield database.

👉 Upgrade Your Subscription - $0.82 per day to become a better investor.
How $500,000 Divides Across the Three
STK carries the smallest weight on purpose, it’s there for growth, not the paycheck. SPYI and ICAP carry the bulk of the income. This split targets a blended yield near 10%.
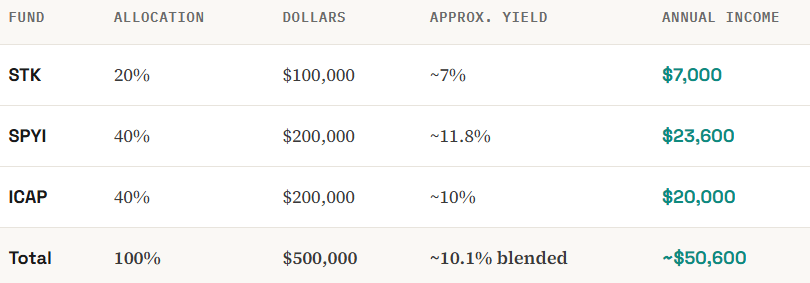
The 10% and $50,000 used earlier in this article were round numbers for the general framework. Run the actual math on these three specific funds today and the blend comes in at 10.1%, just over $50,600 a year. Close to the round example this time, but that will not always be the case, which is exactly why yields need to be checked at the time you actually invest, not copied from an article.
Every yield in that table moves with the market. Check the current numbers in the database before you put real money behind this. Scale the same 20/40/40 split to your own number and the math holds the same way it held for $300,000.
Columbia Seligman Premium Technology Growth Fund STK 0.00%↑
Yield~7%
Expense Ratio:~1.1%
Structure: Closed-End Fund
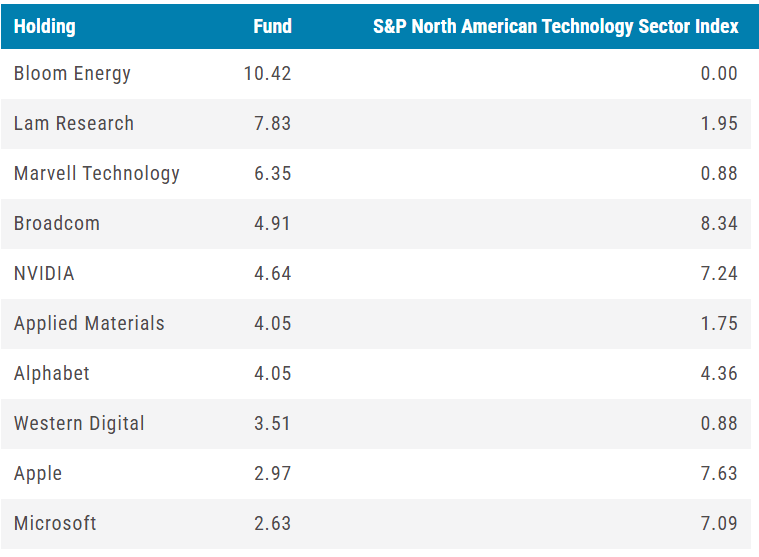
What it holds. Around 60 to 70 US technology names, picked stock by stock rather than tracking an index. Recent top contributors to performance include Bloom Energy, Lam Research, Broadcom, NVIDIA, and Western Digital, spanning chips, semiconductor equipment, storage, and AI infrastructure. This has been actively managed by Columbia’s tech team since 2009.
The strategy. STK writes rules-based covered calls on the Nasdaq-100 index against a portion of the portfolio, not against the individual stocks it holds. It writes more calls when volatility, measured by the VXN index, runs high, and fewer when it’s low. On top of that, a managed distribution policy targets 9.25% of the fund’s original $20 IPO price every year, regardless of where the share price sits today.
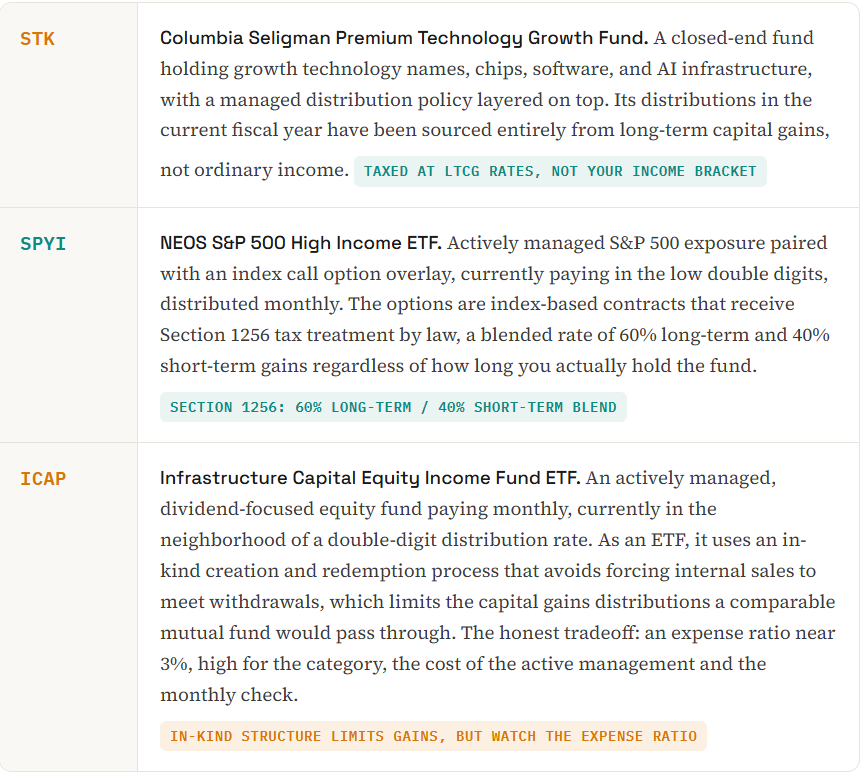
Tax efficiency. This year’s distributions are classified 100% long-term capital gains, not ordinary income. That means they’re taxed at the lower capital gains rate instead of your income bracket, and for some retirees that rate can drop as low as 0% depending on total taxable income.
NEOS S&P 500 High Income ETF SPYI 0.00%↑
Yield~11.8%
Expense Ratio: 0.68%
Structure: ETF
What it holds. Roughly 500 stocks replicating the S&P 500 itself. Top weights are NVIDIA, Apple, and Microsoft. If you’ve seen the S&P’s holdings, you’ve seen this fund’s holdings, there’s nothing exotic in the equity sleeve. Launched in 2022, it’s grown into one of the larger option-income ETFs on the market.
The strategy. SPYI sells, and sometimes buys back, call options on the S&P 500 index itself, not on the individual stocks it holds. That single structural choice is what drives the tax treatment below. The mix of sold and purchased calls is designed to keep some upside alive instead of capping it completely, which is what separates it from a plain covered call fund.
Tax efficiency. Index options like these are Section 1256 contracts by law: a 60% long-term / 40% short-term blend no matter how long you personally hold the fund. Part of the monthly payout is also classified as return of capital, which defers the tax bill further instead of taxing it as income the year you receive it.
Infrastructure Capital Equity Income Fund ETF ICAP 0.00%↑
Yield: ~10%
Expense Ratio: ~2.5%
Structure: ETF
What it holds. Around 200 dividend-paying US equities. Recent top positions include Amazon, Global Net Lease, McDonald’s, Freeport-McMoRan, and Apollo Global Management, a genuine mix of large caps, REITs, financials, and materials rather than a single-sector bet. Run by Infrastructure Capital Advisors since 2021.
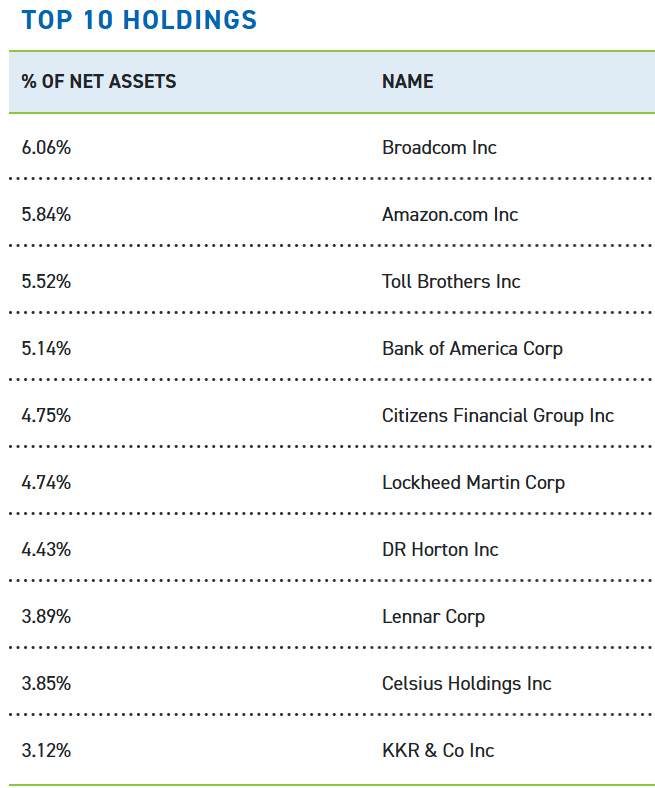
The strategy. Bottom-up stock picking aimed at growth at a reasonable price, layered with a selective covered call overlay on individual positions and modest leverage, roughly 15 to 30%, to push the yield higher than the underlying dividends alone would produce.
Tax efficiency. As an ETF, its in-kind creation and redemption process limits the capital gains the fund has to distribute in the first place, compared to a mutual fund that’s forced to sell holdings to meet redemptions. The honest tradeoff is the fee: the expense ratio runs close to 2.5%, high for the category, the cost of the active management and the monthly check.
Your Number Isn’t $500,000
The subscriber who started this article had $300,000 and a life in Mexico that cost $2,500 a month. Run his number through this same framework and he lands close to $30,000 a year, more than enough to cover it, without selling a single share. The dollar figure changes. The three-part process doesn’t: pick the percentage you need, choose funds where the tax treatment does real work, and check that the yield is coming from somewhere real before you commit to it.
That process is also the limit of what one article can do for you. It can hand you the framework and three funds that pass the test. It cannot know your tax bracket, your state, your timeline, or what else sits in your portfolio already, and those are exactly the variables that turn a general framework into a specific allocation.
I am at capacity for calls the next few weeks, but a written portfolio report gets you the version built around your actual account instead of a hypothetical $500,000.
Added $500 to STK yesterday.