

Your Index Fund Was Never Diversified
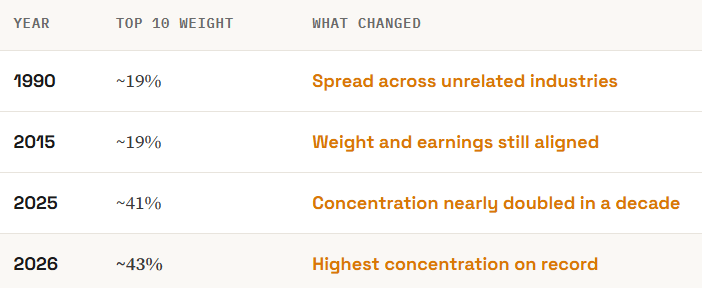
Buy an S&P 500 index fund and most people believe they now own a slice of 500 different companies, spread across every sector of the economy. That belief was roughly true in 1990. It is not true today. The top 10 holdings now make up around 43% of the index, the highest concentration ever recorded, and most of those 10 names sit in the same sector chasing the same AI theme.
Run the numbers further out and it gets more extreme. The top 25 names account for over half the index. NVIDIA NVDA 0.00%↑ alone is close to 8% of the entire S&P 500. If you own a plain index fund, nearly half your money already rides on a small group of companies that all rise and fall together when sentiment on one theme shifts.
This didn’t happen overnight. In 1990, the 10 largest companies in the index, names like IBM, Exxon, and General Electric, made up about 19% of it, spread across totally unrelated industries. That balance held for two decades before the platform economy and now the AI buildout concentrated the index into a small number of correlated mega-caps, nearly doubling in the last ten years alone.
The index is still a reasonable investment. But the word "diversified" stopped accurately describing it a while ago, and pretending otherwise is how people end up more exposed to a handful of stocks than they realize.
Concentration by Accident vs. on Purpose
Once you accept that the index is already concentrated, the real question changes. It’s no longer “should I diversify or concentrate.”
You’re concentrated either way the moment you buy the index. The actual question is whether that concentration was chosen on purpose or assigned to you by a formula that has nothing to do with quality.
Market-cap weighting doesn’t select for the best companies. It selects for the biggest ones, and being the biggest isn’t the same thing as being the best risk-adjusted holding. How else do we explain why Tesla TSLA 0.00%↑ is a large holding in the S&P 500?
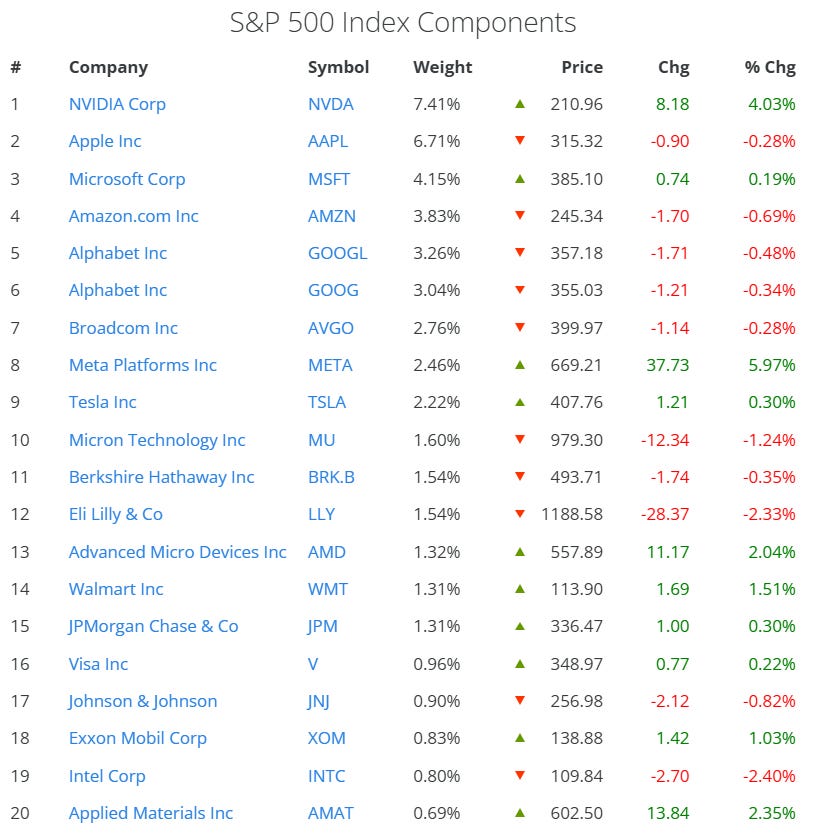
Worse, there’s a feedback loop built into it: money flowing into index funds automatically buys more of whatever is already the largest, which pushes those names higher, which makes them an even bigger share of the index, regardless of whether their fundamentals still justify the weight.
That loop is exactly why I don’t just buy the index and call it a day. I’d rather own a smaller set of large-cap companies, selected for specific, measurable traits, than own whatever the market happened to bid up the most this cycle. Same size companies. Different reason for owning them.
👉 This is how you outperform the market.

Large caps still have the balance sheets, the cash flow, and the staying power that make them the right foundation for most portfolios. The fix here has nothing to do with abandoning them for small caps or exotic sectors. It’s about choosing which large-caps on purpose instead of letting a formula choose for you.
What “Risk-Adjusted” Actually Means
Two stocks can both return 15% in a year and still be completely different investments. If one of them got there by swinging up and down 40% along the way and the other climbed in a straight line, they are not equally good holdings, even though the return on paper looks identical. Risk-adjusted return measures how much return you got for how much volatility you had to sit through to get it, not just the return number by itself.
👉 Upgrade Your Subscription - $0.82 per day to become a better investor. Paid subs get buy alerts first.

Academic research on this goes back decades, and one finding shows up over and over: less volatile stocks have historically delivered better risk-adjusted returns than highly volatile ones.
In one long-running global study, a low-volatility approach posted the highest Sharpe ratio of any major factor tested, meaning the smoothest return per unit of risk taken, while a quality-focused approach (profitable companies with strong balance sheets and low debt) showed a meaningfully smaller maximum drawdown than the broader market during selloffs.
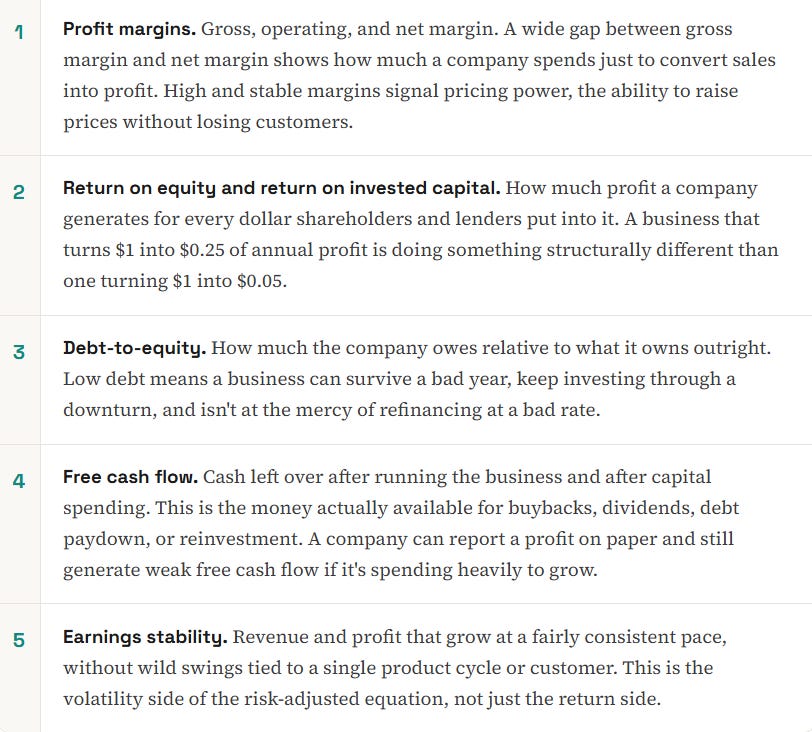
5 Traits To Look For
Quality comes down to a short list of numbers sitting in every company’s financial statements, free for anyone to pull up. Here’s what I actually check.
Factor strategies go through real stretches of underperformance, sometimes for years, and low volatility in particular can lag hard during a raging bull market concentrated in a few names, which is exactly the environment we've been in. This is a long-term tilt, not a way to beat the index every single quarter.
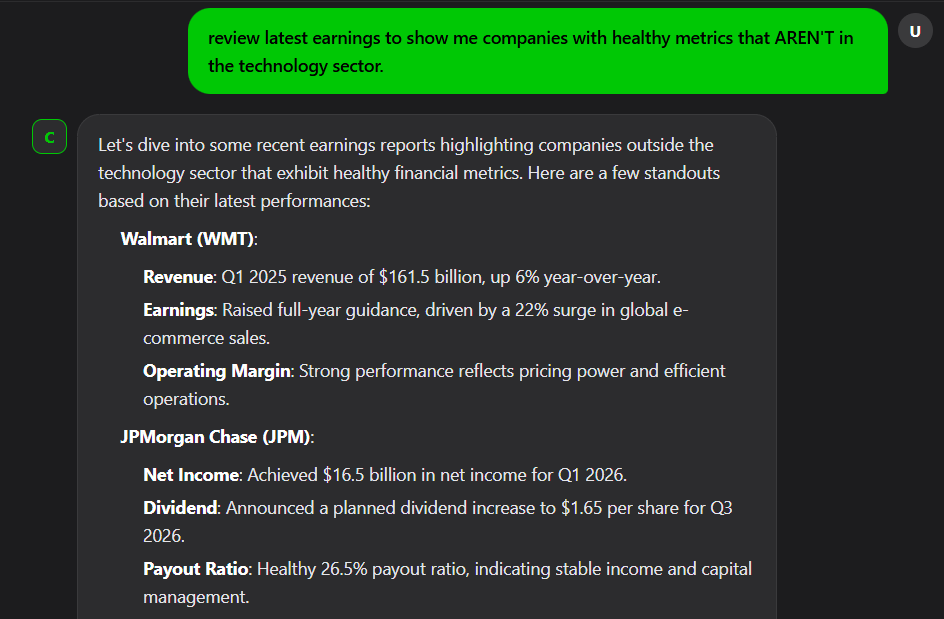
Want to make it easy? Unlock access to CainAI — Ask for the companies that have healthy metrics! Plug in the latest earnings data and analyze a company’s strength in seconds.

2 Examples: Reading the Checklist
Both of these sit in the S&P 500’s top holdings. Both get lumped together as “mega-cap tech.” Run the actual checklist on each one and you get two completely different quality profiles, which is the whole point: the index treats them as interchangeable weight.
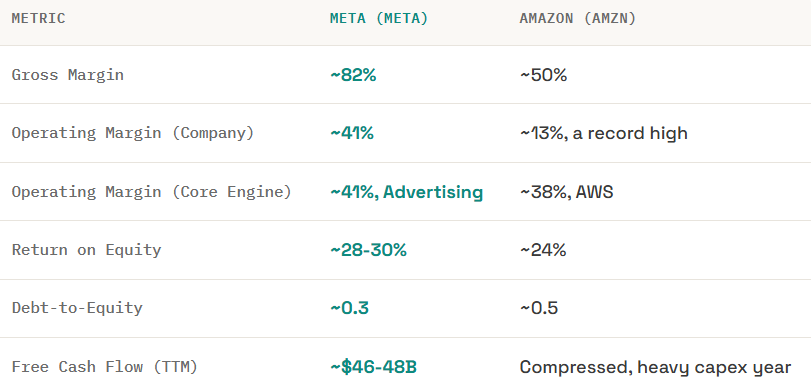
Meta META 0.00%↑ is close to a textbook example of the checklist working the way it’s supposed to. Roughly 82% gross margin and 41% operating margin means the advertising business keeps most of every incremental sales dollar. ROE near 30% and debt-to-equity near 0.3 means it’s generating that profit without leaning on borrowed money. Free cash flow around $46-48 billion over the trailing year means the profit on paper is showing up as real spendable cash, not just an accounting number.
Amazon AMZN 0.00%↑ looks weaker on the surface and is actually the more interesting read once you open the hood. The company-wide operating margin of ~13% just hit a record high, and it’s a blended number covering three very different businesses. AWS alone runs at close to a 38% operating margin, in the same neighborhood as Meta’s entire company, and just posted its fastest growth in 15 quarters on a $150 billion annualized revenue base. The advertising segment is smaller but growing 24% a year at a similarly high margin. Retail and logistics are the low-margin piece dragging the blended number down, and they’re also the piece funding the buildout of the other two.
👉Here’s 5 companies that fit the specific growth profile for the next twelve months!

You’re Already Concentrated. Choose It.
The comfortable story about index investing is that it spreads your risk across the whole market. At 43% concentration in 10 names, that story is no longer accurate, whether or not the fund’s marketing still says so. You are already making a concentrated bet. The only open question is who’s making the selection, a market-cap formula with a feedback loop built into it, or you, using criteria that actually measure quality.
Know what you actually own, and consider putting new capital toward large-cap names chosen for risk-adjusted strength instead of assuming size alone did the work. The index will keep concentrating as long as the formula rewards size. Your own selections don’t have to.
What's your opinion about grabbing some 2x leverage of these stocks like AMZZ or MSFL?