

I think the stock market is still relatively cheap. I consistently say it: don’t listen to the doomers out there claiming that AI will end the world.
Waiting for a market crash can feel like discipline. You keep the cash, watch prices climb, and tell yourself you’ll get interested when everything goes on sale.
But what if the businesses improve faster than their stocks rise?
A company can cost more than it did three months ago and still offer more earnings for every dollar you invest. Meanwhile, the stock that dropped 20% might be the worse deal if its profits are disappearing even faster.
Just look at how Nike NKE 0.00%↑ has performed over the last few years. Nike currently trades at a forward price to earnings of 27.4x.
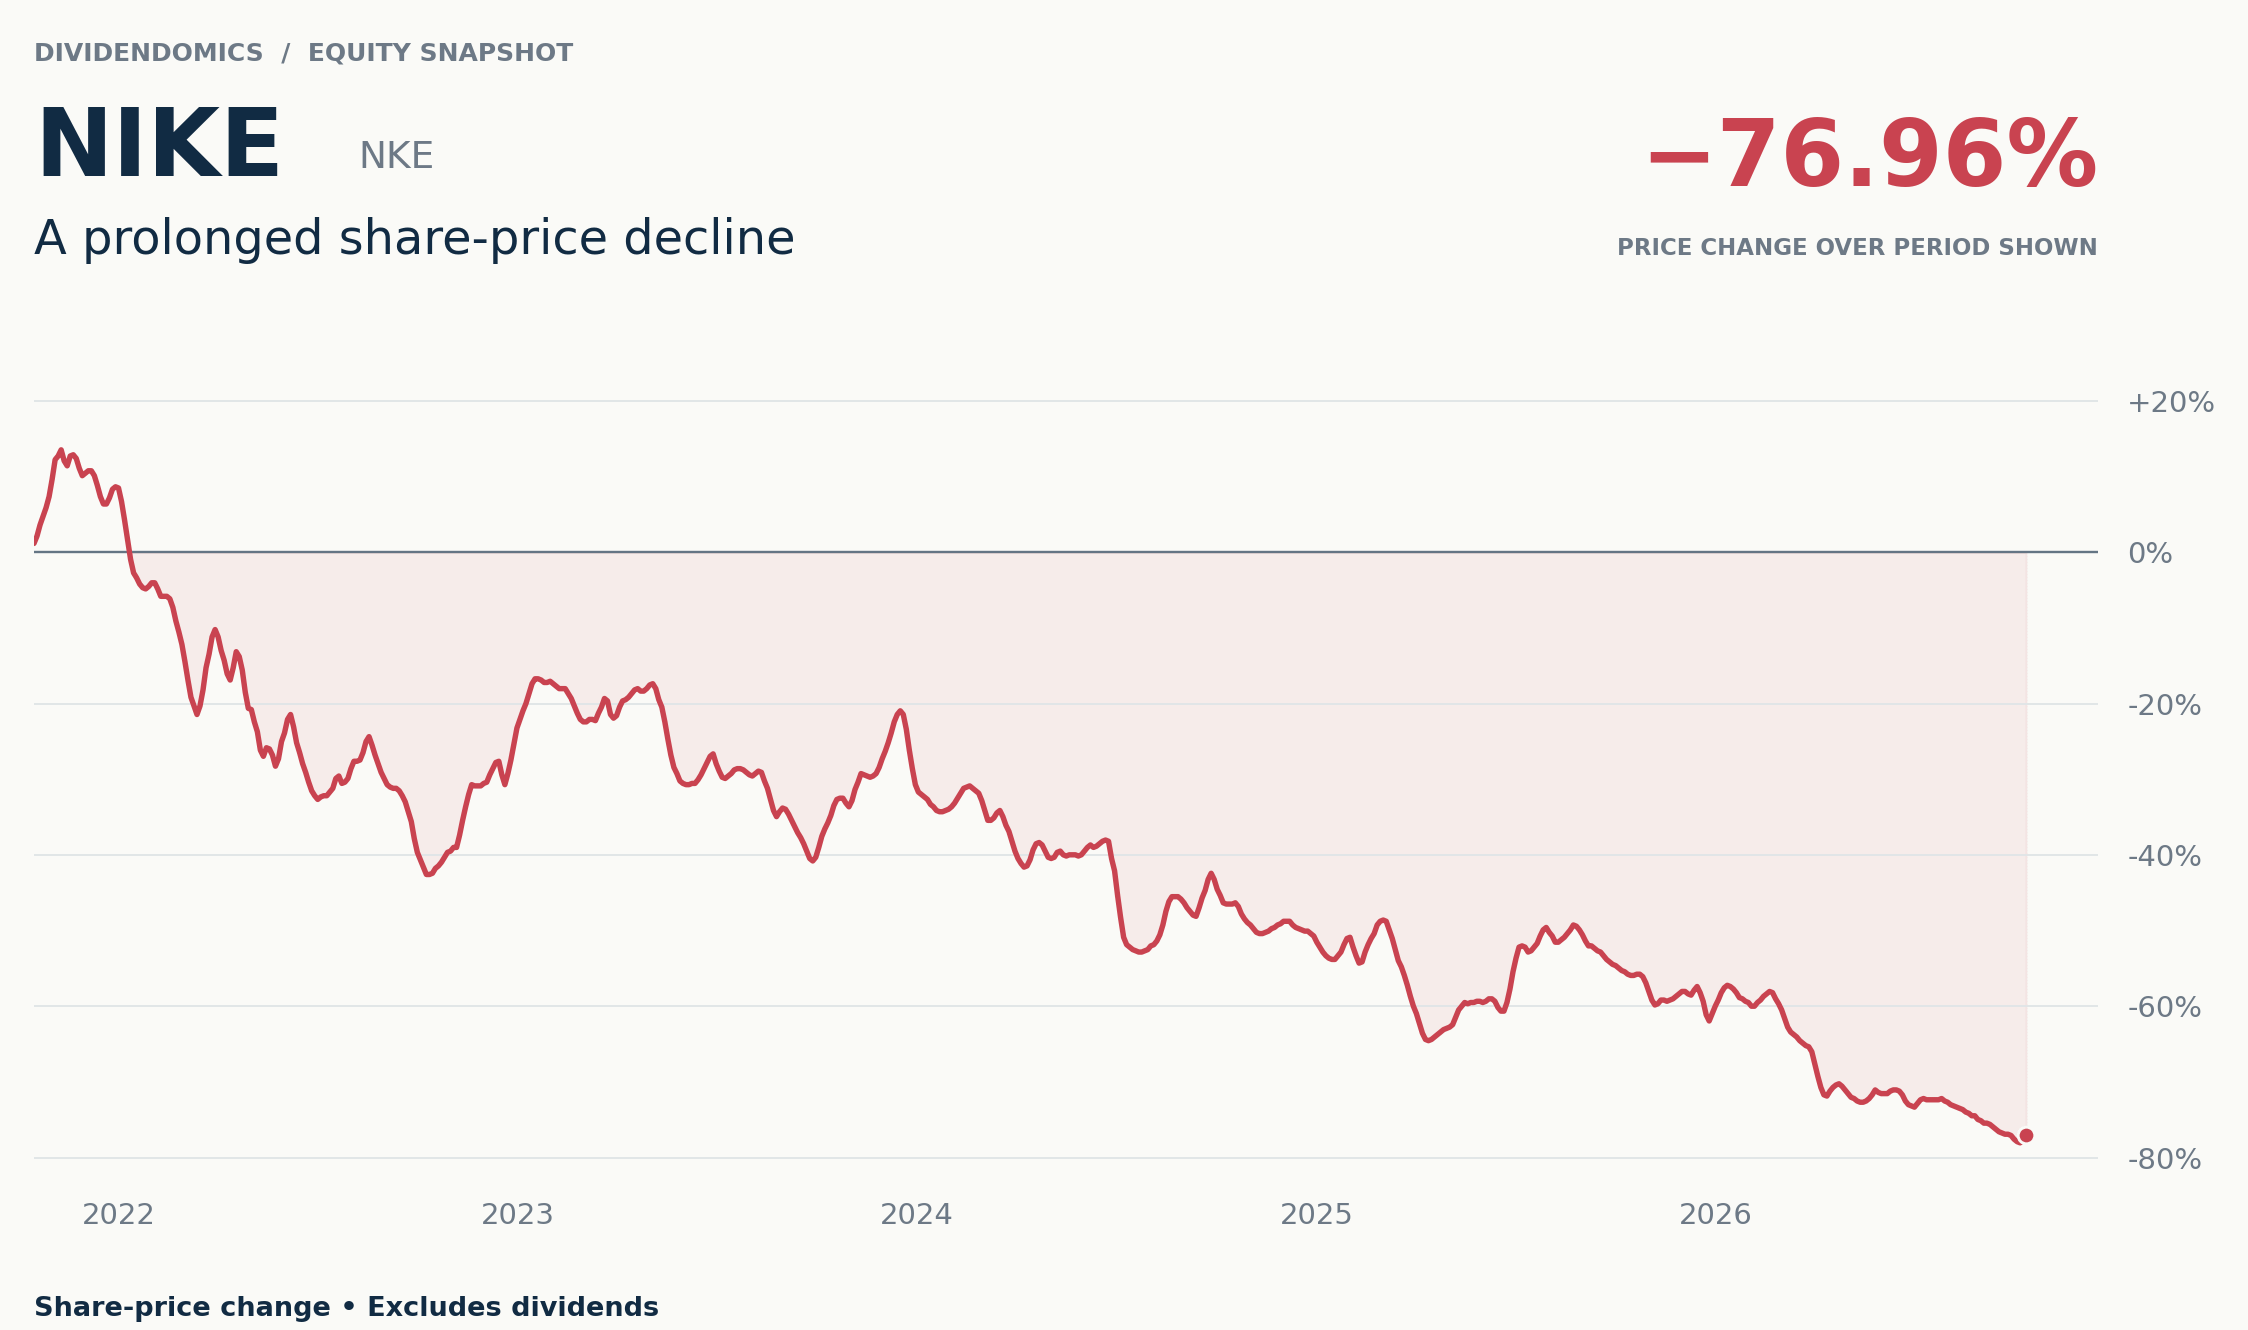
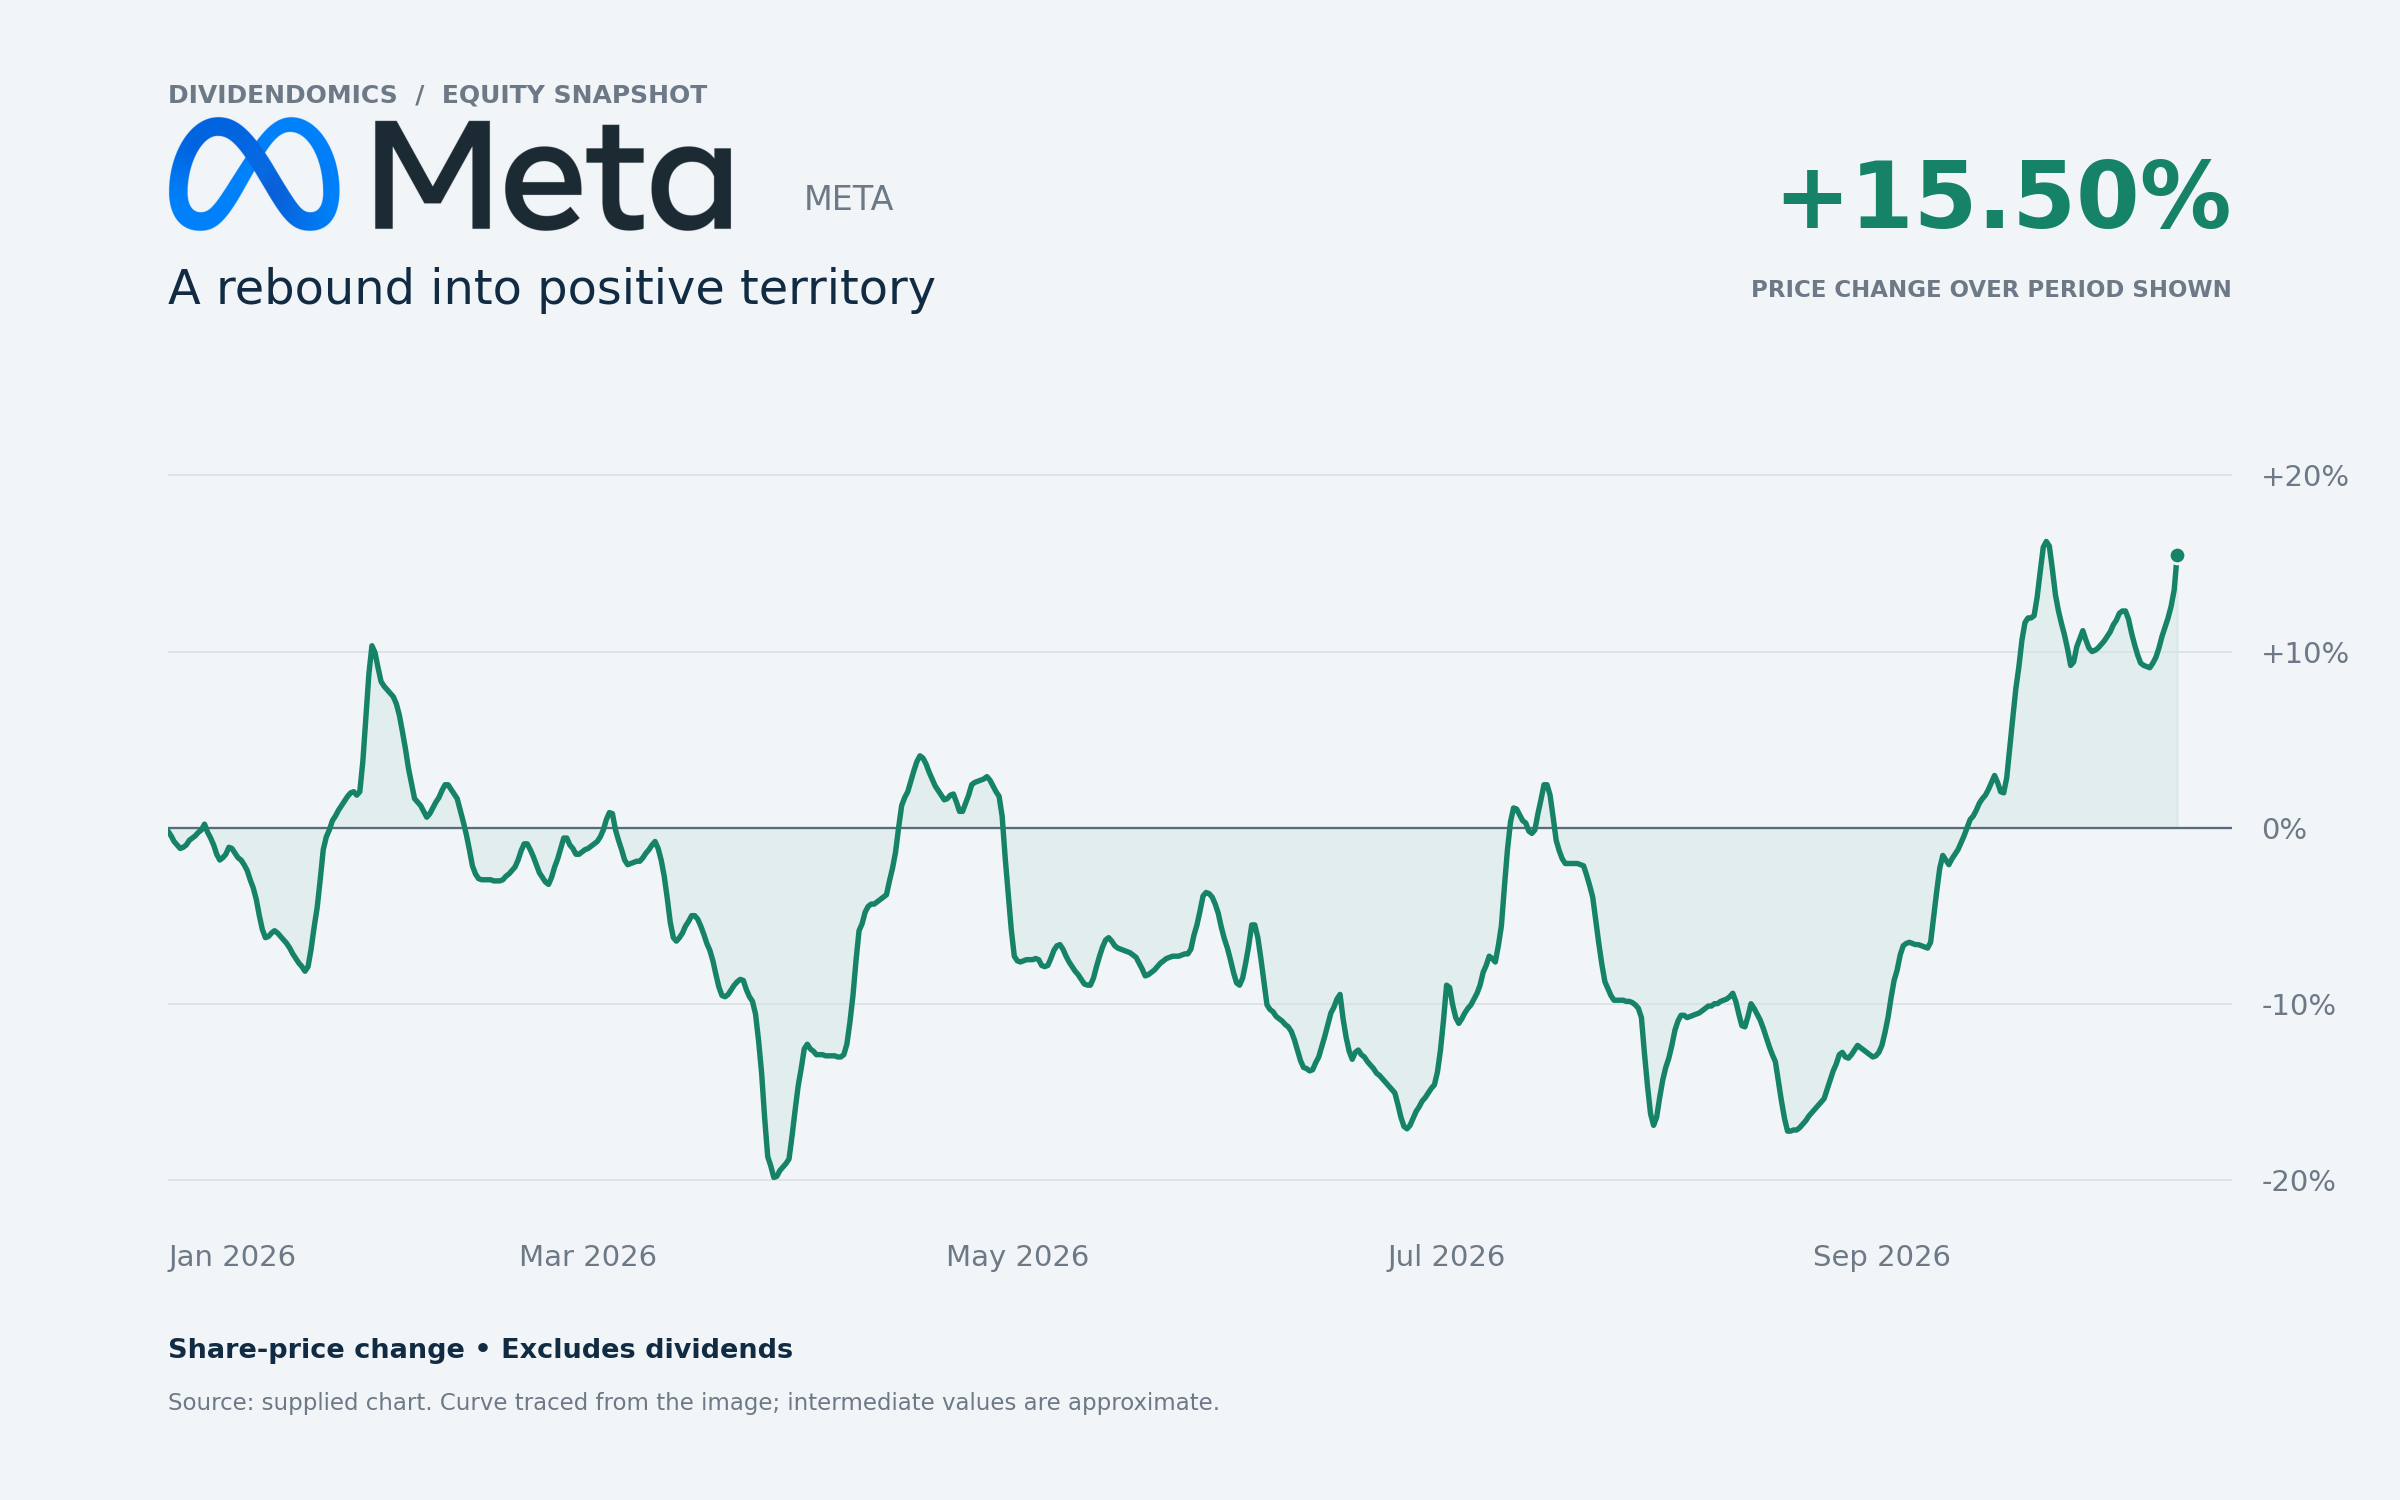
Meanwhile, Meta trades at a forward P/E of just 24x. So yes, META’s stock is technically cheaper than Nike. Crazy right?
Meta Platforms META 0.00%↑ jumped up over the last few weeks but I still think it is incredibly undervalued.
For me, this eventually comes back to income. I want a portfolio that can pay me more over time, and that requires paying attention to what the businesses earn before deciding how much cash I can take out.
Sometimes that cash arrives as a dividend increase. Sometimes growth builds a larger amount of capital that can support income later. And sometimes reaching for a bigger payment today means giving up more future upside than I intended.
That last tradeoff matters a lot in a market where earnings are still expanding.
👉 Subscribe to Dividendomics for my portfolio updates, income reports, and the reasoning behind the changes I make.
The Sale Doesn’t Always Show Up In Red
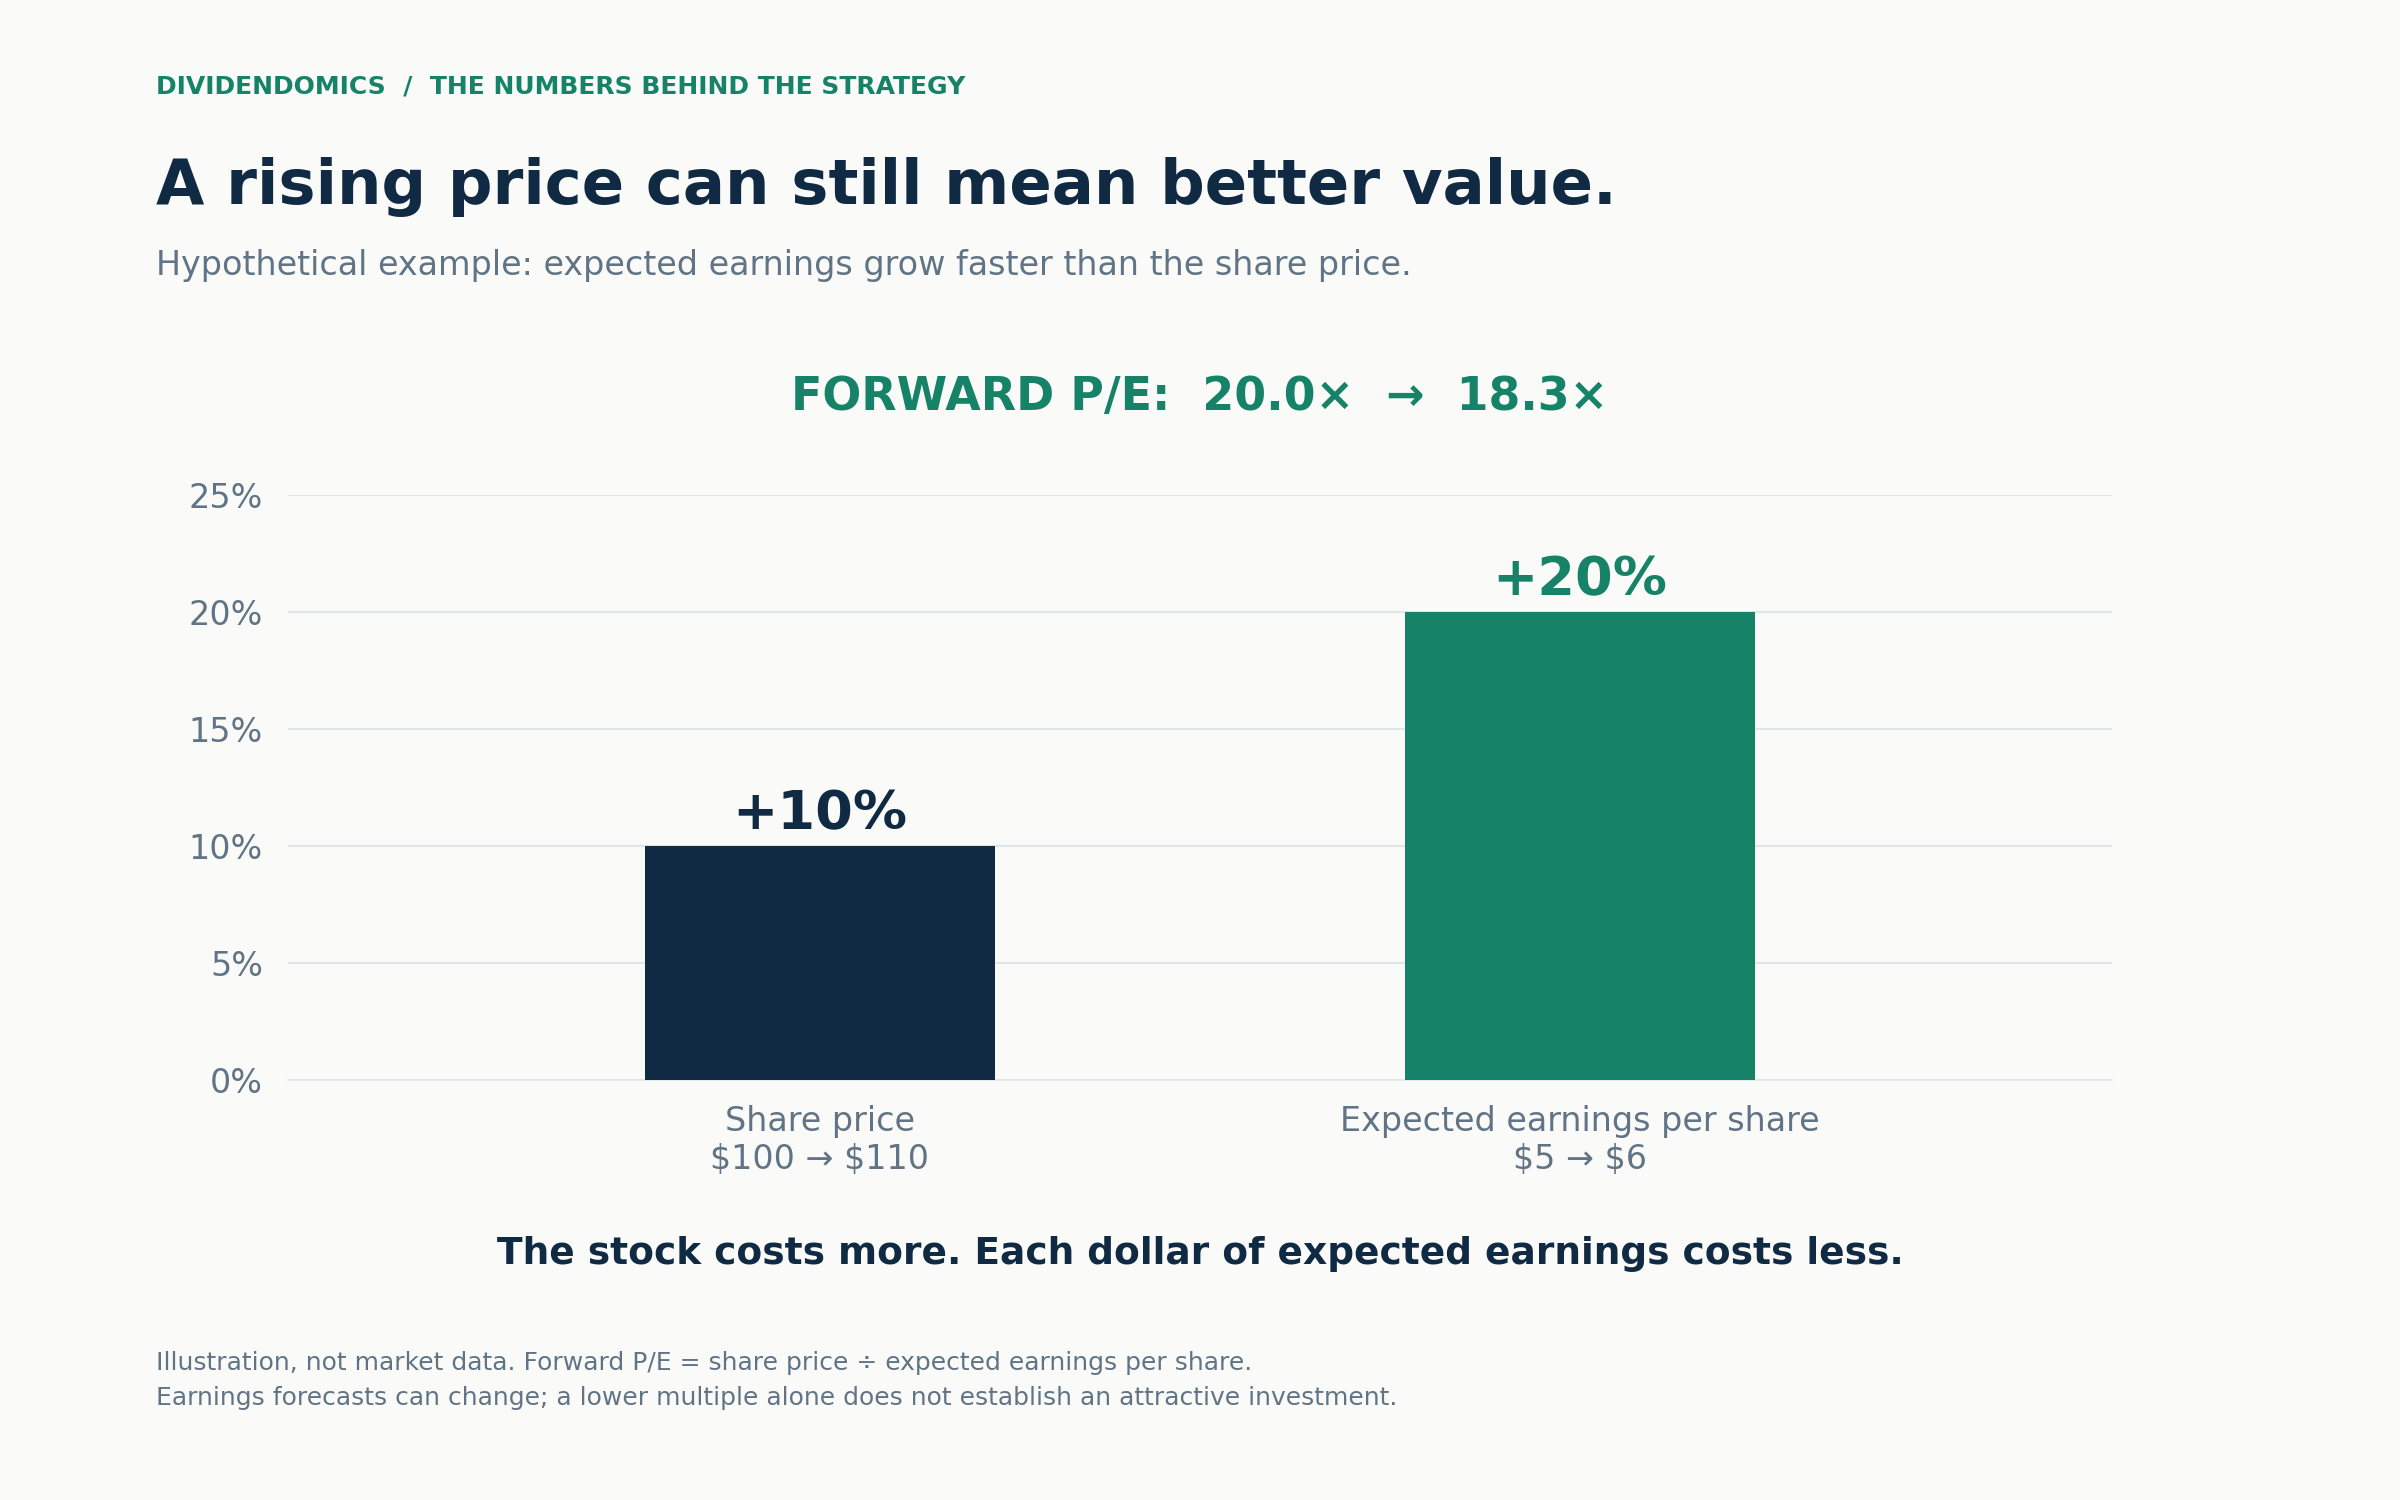
Imagine a business trading at $100 per share with expected annual earnings of $5. You’re paying 20 times those earnings.
Now the stock rises to $110, while its expected earnings increase to $6. You missed a 10% rally, but the valuation has actually fallen to about 18.3 times earnings. The price went up less than the business’s expected earning power.
That’s hypothetical math, but the same distinction is relevant to the broader market.
In its October 2 earnings preview, FactSet put the S&P 500’s forward earnings multiple at 19.0, down from 20.4 at the end of June. That early-October reading was also below its five-year average of 19.8 and slightly below its ten-year average of 19.1.
FactSet’s October 9 update showed a 29.6% third-quarter earnings growth rate, combining reported results with estimates for companies still to report. Only 19 index members had released results at that point, so most of the number was still an expectation.
I’m encouraged by that growth.
The AI Trade Has To Pass A Cash Test
The next stage of the AI story interests me because the spending needs to produce something shareholders can eventually benefit from.
Buying more servers proves that a company is investing. It doesn’t tell me what return those servers will earn, how quickly they become outdated, or how much additional spending will be necessary just to stay competitive.
This is where I think the large cloud and advertising businesses deserve a closer look. They have existing customers and established ways to monetize demand. If AI improves those businesses, shareholders may benefit through higher revenue, better margins, or both.
Take Amazon’s second-quarter results. Its operating income rose 43% to $27.5 billion, and AWS revenue grew 37%. Over the trailing twelve months, operating cash flow reached $161.4 billion, up 33%.
At the same time, Amazon reported a $7.6 billion free cash flow outflow over that trailing period. Its investment spending, primarily related to AI, absorbed more than the cash left under that measure. Reported quarterly net income also included $53.4 billion of non-operating pretax other income, primarily tied to its Anthropic investments.
My reading is that the operating business is growing strongly, while the cash payoff from this investment cycle remains something to prove. Headline net income alone would give an incomplete picture.
That changes what I’m watching across the group.
Can revenue from the new capacity keep growing?
Do operating margins hold up as depreciation builds?
Does cash generation eventually grow faster than the spending needed to support it?
If the answers improve, I can see a case for more attention shifting toward the businesses using the infrastructure. That’s a possibility, not an inevitable rotation away from chipmakers.
I also wouldn’t assume the cheapest-looking earnings multiple identifies the best opportunity. Temporary investment gains or unusually strong cyclical profits can make a stock look inexpensive at exactly the wrong time.
How This Becomes A Bigger Paycheck
There are two ways I connect business growth to future portfolio income.
The first is direct: a company earns more, generates enough cash after reinvestment, and decides to increase its dividend.
Microsoft provides a recent example of an actual payout decision. On September 15, the company raised its quarterly dividend to $0.98 per share, up from $0.91.
I explored this more in 4 Stocks That Give Bigger Raises Than Your Job. The starting yield tells you what a position pays now. The cash supporting the dividend helps you judge whether that payment has room to grow.
The second route is through the size of the portfolio itself.
Here’s a simple illustration:
At an assumed 4% annual cash yield, $100,000 produces $4,000 a year. If the capital available eventually reaches $150,000, that same assumed yield produces $6,000. The additional $2,000 comes from having more capital working, without needing a higher yield.
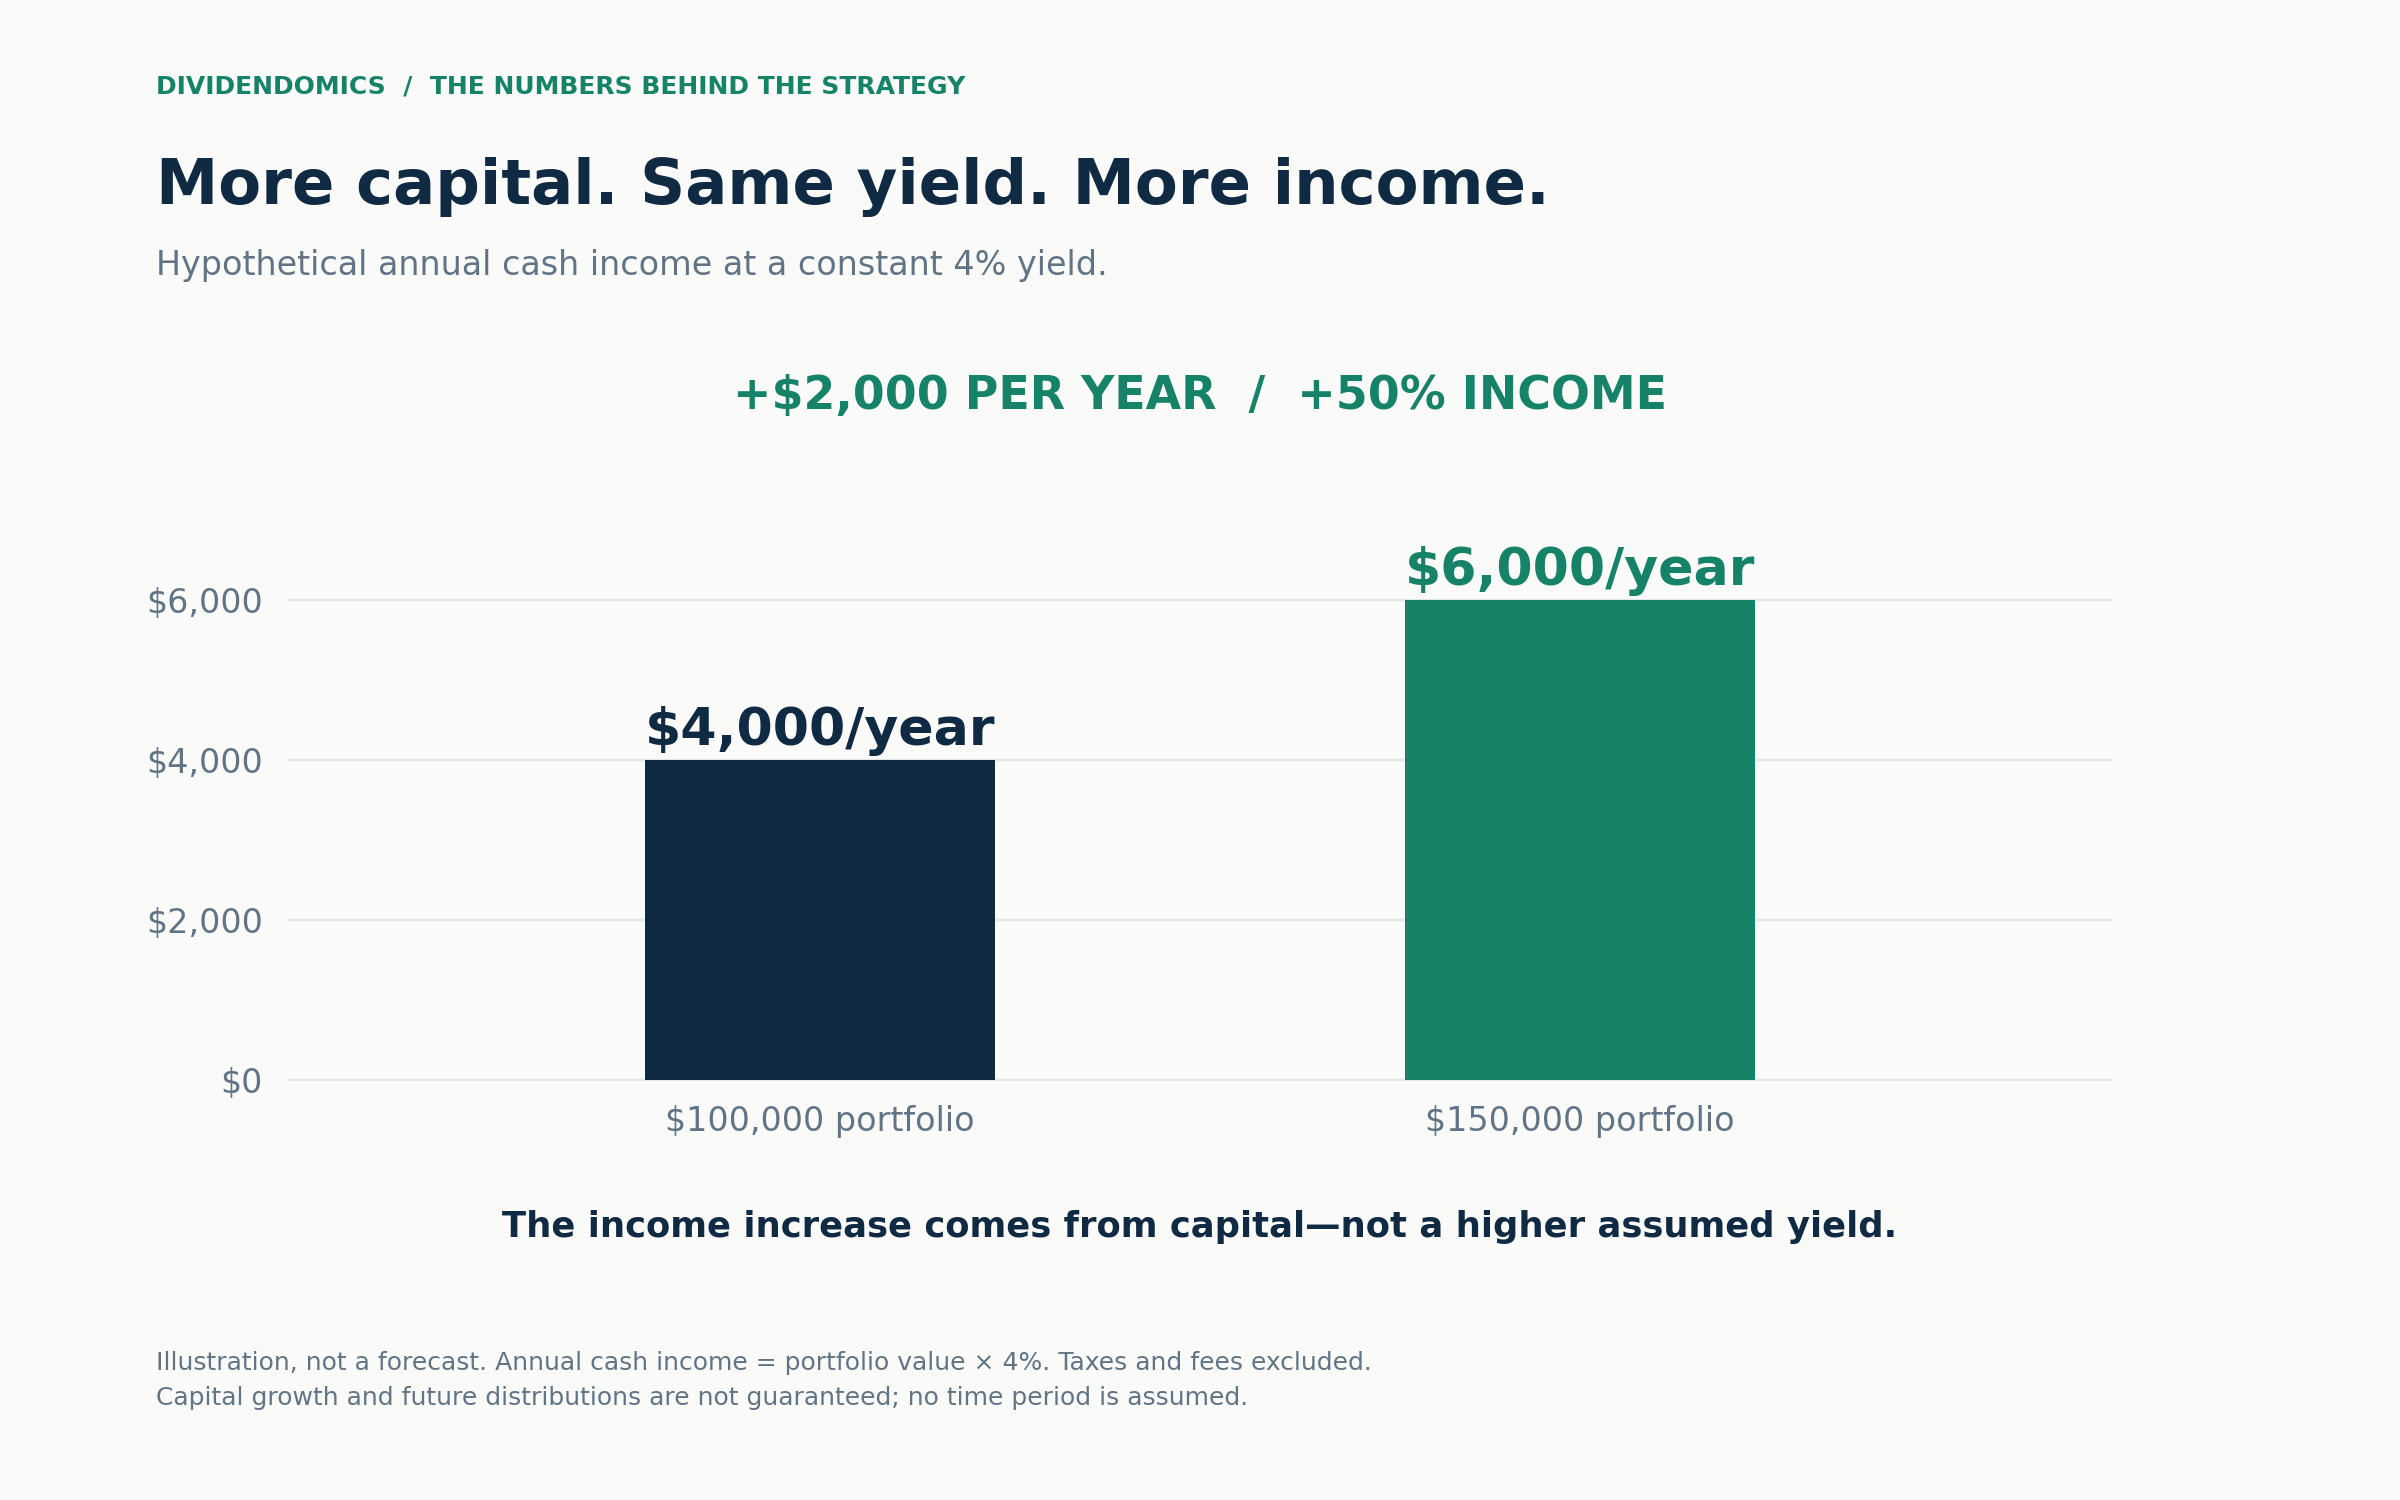
Growing the capital involves risk, realizing gains can create taxes, and the investments available later may offer different payouts. It shows why portfolio growth belongs in an income discussion.
This is a tradeoff I’ve already made in my own account. In my August dividend report, I explained why I accepted a lower projected dividend total while reallocating capital toward growth. The immediate reduction in income was real. The larger future payoff was still a thesis.
That distinction matters. I can measure the income I give up today. I have to earn the future result.
Someone relying on every distribution for living expenses faces a different decision from someone reinvesting those payments for another decade. The time available changes how much uncertainty the plan can tolerate.
Getting Paid Now Has A Price
Covered calls add another wrinkle to this setup, especially for income investors who also expect strong earnings growth.
The premium is visible immediately. The upside you surrender is much easier to ignore until a stock jumps past your strike price.
The Options Industry Council’s explanation lays out that exchange: selling a covered call brings in premium while limiting potential gains during the contract. Assignment can require selling the shares, and substantial downside exposure remains.
Here’s a hypothetical example, ignoring dividends, fees, and taxes. You own 100 shares at $100 and sell a $110 call for $2 per share. If the stock finishes at $130 at expiration and you’re assigned, the combined gain is $1,200: $1,000 on the shares plus $200 in premium. Simply holding would have produced a $3,000 unrealized gain at that price.
You made money. You also gave up $1,800 of additional upside.
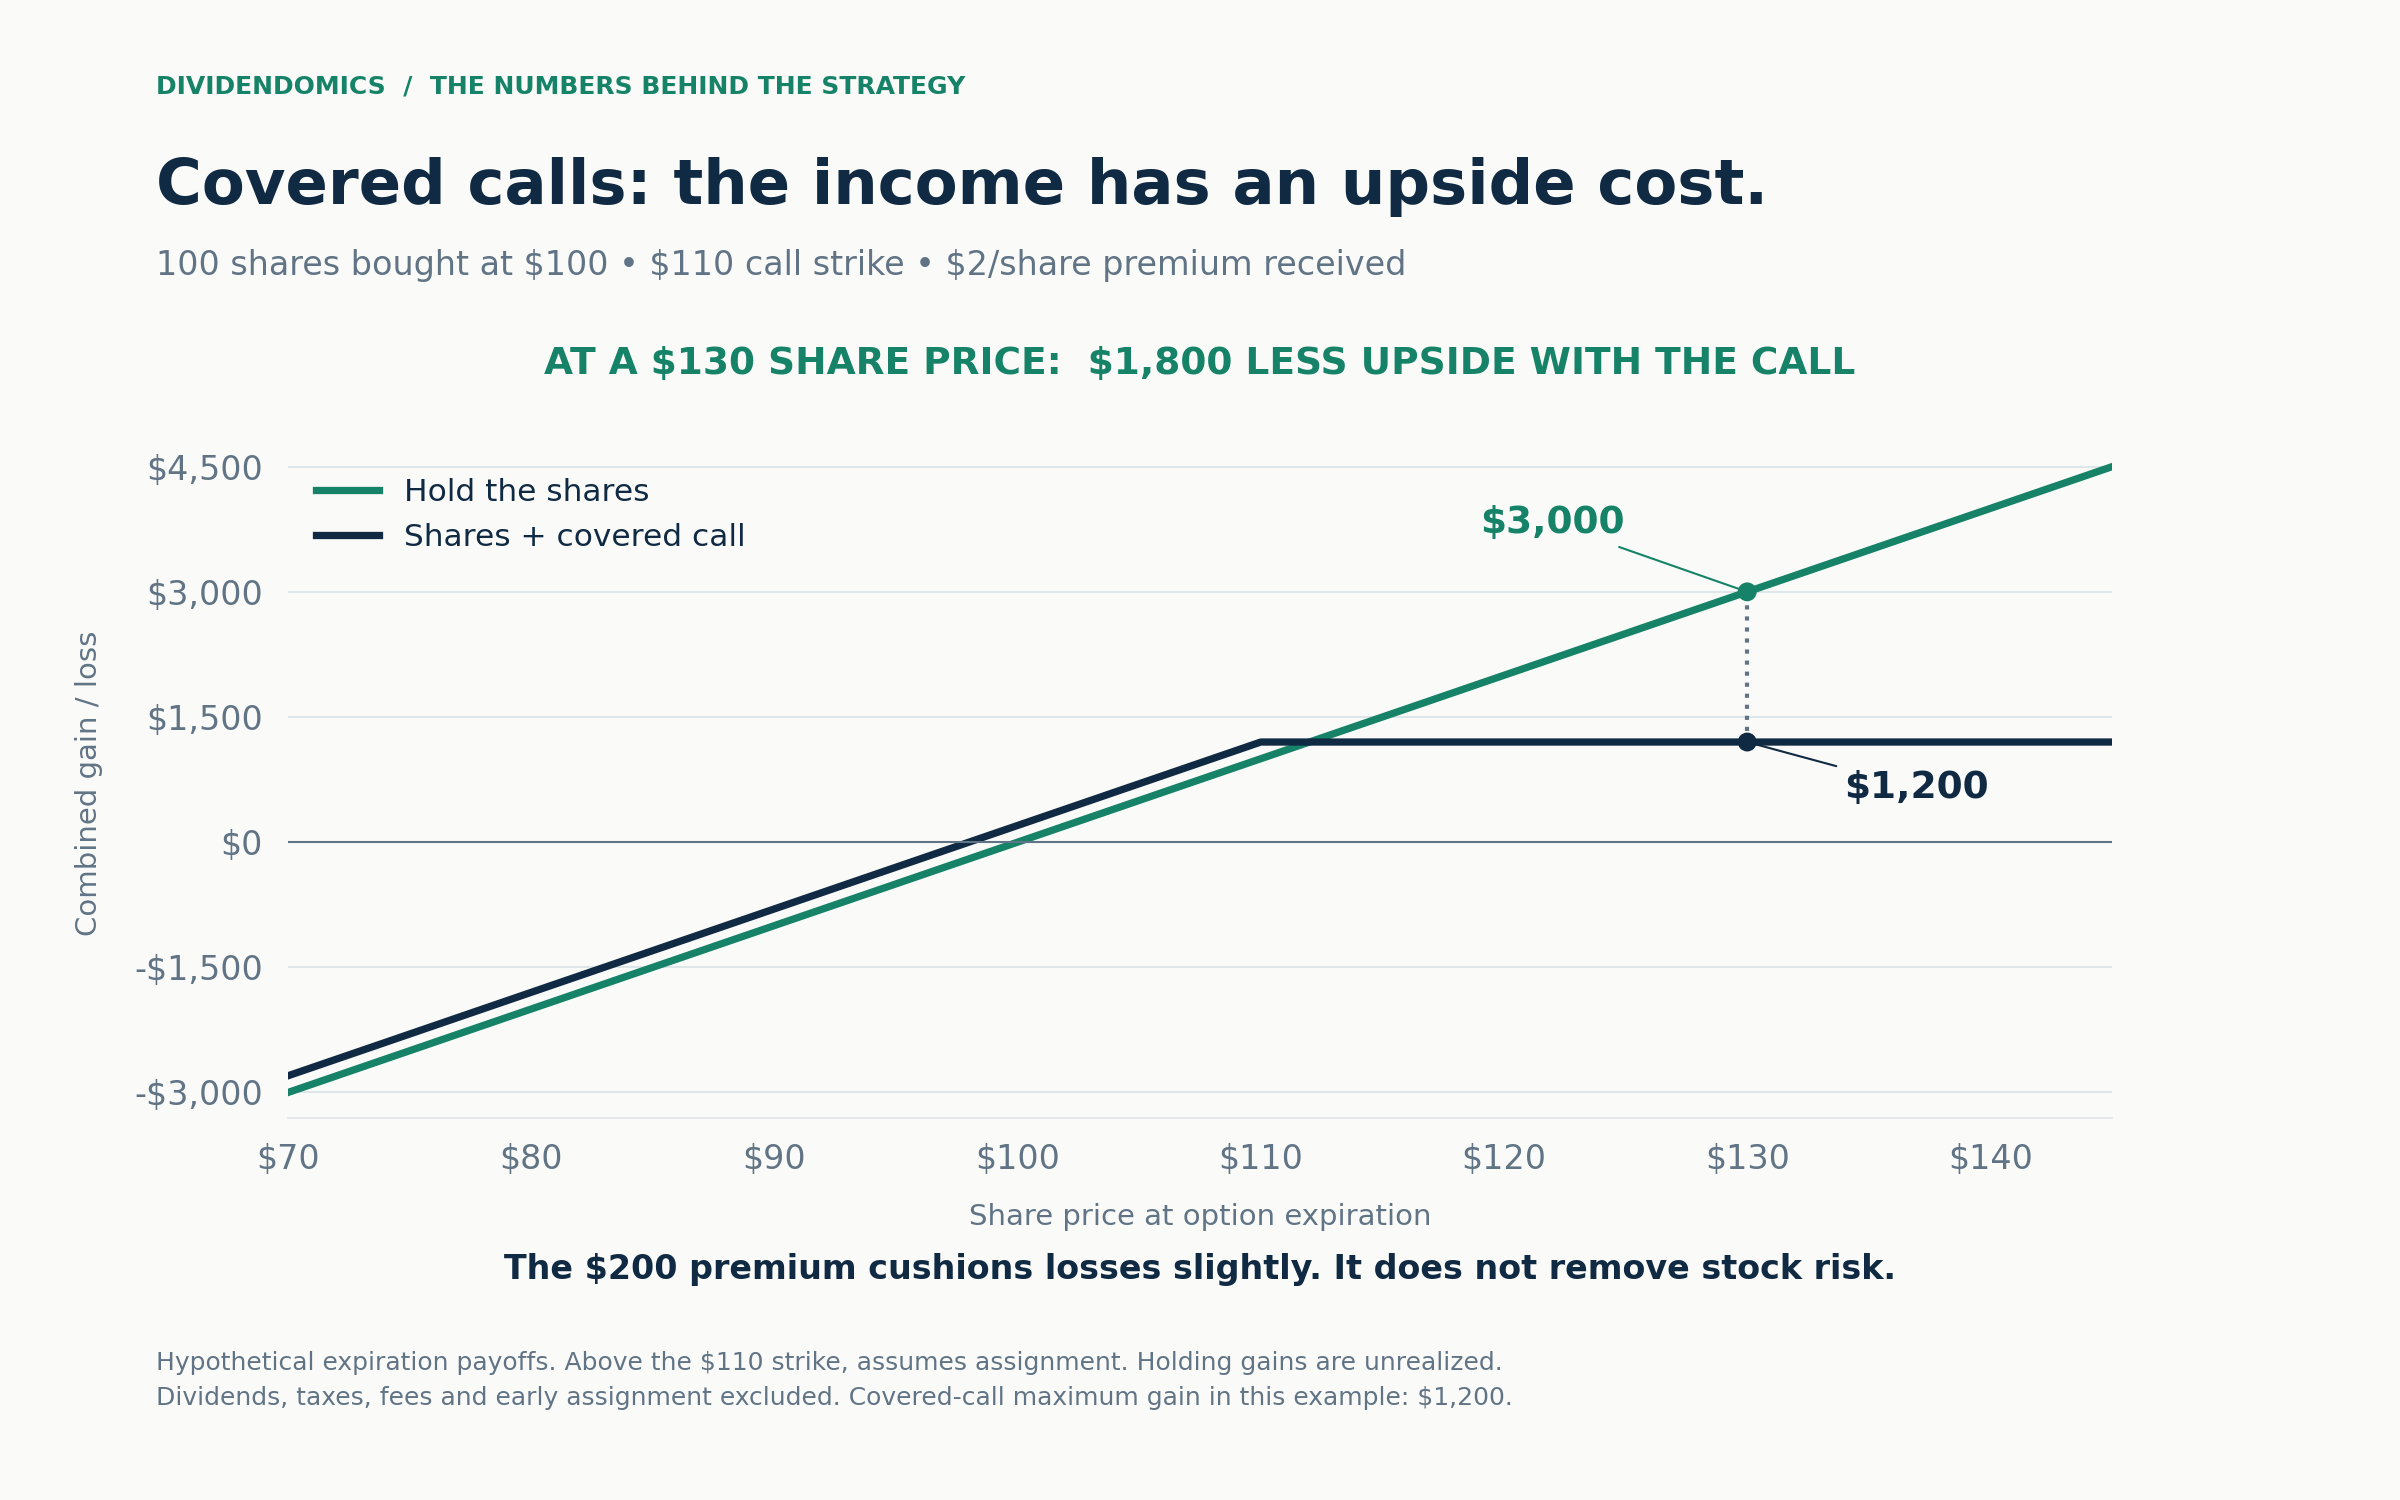
That can be an acceptable outcome if $110 was a price you were happy to sell at. It becomes a problem when the income target overrides the reason you owned the business.
I use covered calls, and my beginner’s guide explains the mechanics. But an expectation of strong growth makes the strike price and willingness to sell especially important. The largest available premium doesn’t answer either question.
What I’m Checking Before The Next Decision
The practical work here is something readers can do without predicting next week’s market direction.
For any holding or watchlist company, I’d write down these five questions before its earnings release:
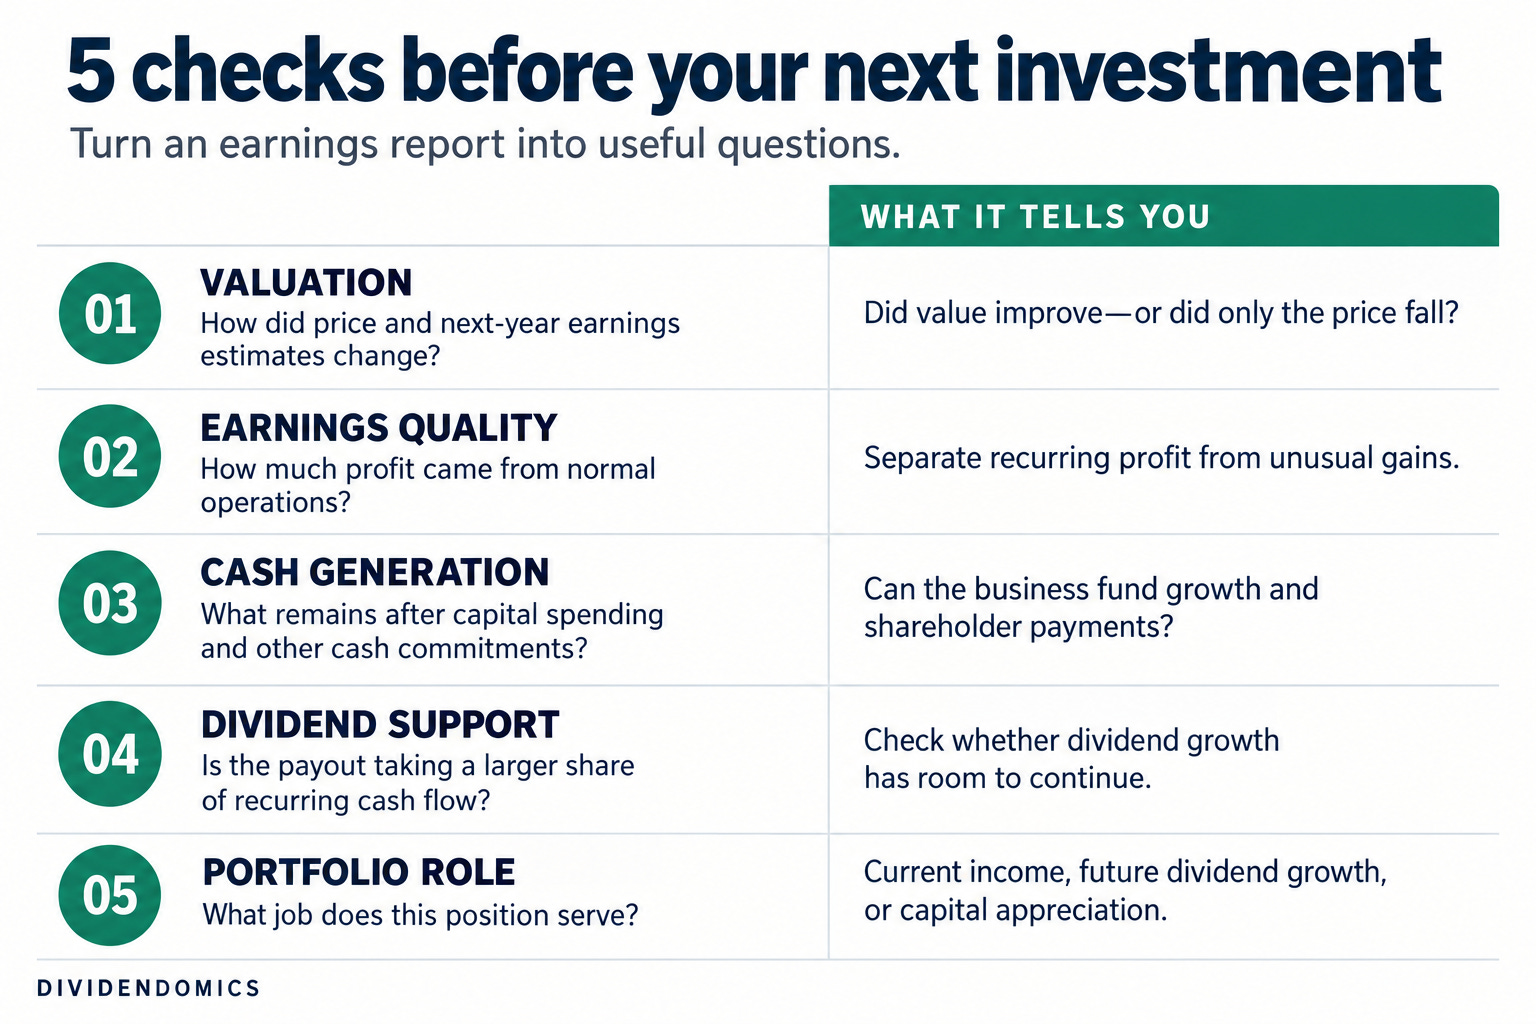
For ordinary operating companies, those cash questions are a useful starting point. Banks, REITs, and other specialized businesses need measures suited to their economics.
For an income fund, I’d add a review of total return, changes in net asset value, and the sources of its distributions. Cash arriving in the account is only one part of the result.
Then I’d stress the valuation assumption. A stock priced at 19 times expected earnings becomes roughly 21.1 times earnings if that forecast falls 10% and the share price stays unchanged. Nothing about the price chart has to move for the apparent bargain to shrink.
That’s the risk I want attached to the bullish case. Demand can disappoint, spending can stay elevated, and higher required returns can push valuations lower even when profits grow.
I’m willing to look for opportunity while the index is high because the underlying businesses can improve faster than the price suggests. But the evidence I want is fairly specific: recurring earnings, cash after reinvestment, and a clear role for the investment in the income plan.
My goal is a portfolio that gives me more financial freedom over time. A bigger dividend check helps. So does a larger pool of capital capable of supporting those checks later. The challenge is knowing what today’s income is costing me to collect.
👉 Become a paid subscriber to follow my portfolio changes, monthly income reports, and the research behind those decisions.
Which matters more at your current stage: increasing the cash your portfolio pays today, or building what it could pay five years from now? Let me know in the comments.
